Mean and variance of the random variable

The mean of a random variable is also known as its expected value. It is a measure of the central tendency of the distribution of the random variable. The expected value of a discrete random variable X with possible values x1, x2, …, xn and corresponding probabilities P(X = x1), P(X = x2), …, P(X…

Random variable

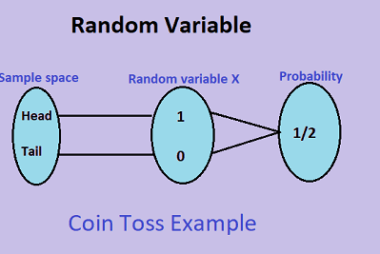
A random variable is a variable whose value is determined by the outcome of a random event. In probability and statistics, random variables are used to model the uncertainty in the outcomes of experiments or processes. There are two types of random variables: discrete and continuous. A discrete random variable takes on a countable number…

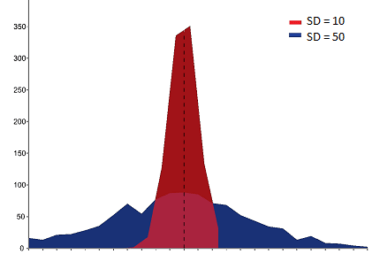
Analysis of the frequency distribution with same mean but different variance

In probability and statistics, the frequency distribution refers to the pattern of how often certain values occur in a dataset. The mean and variance are two important statistical measures that describe the central tendency and variability of a dataset, respectively. If we have two frequency distributions with the same mean but different variance, we can…

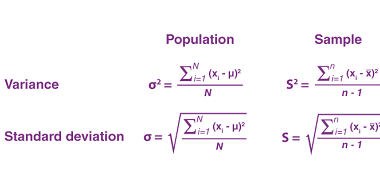
Standard deviation and variance of grouped and ungrouped data

Standard deviation and variance are measures of variability that provide information about how spread out a dataset is. The standard deviation is the square root of the variance, and it measures the average deviation of each data point from the mean. In general, the larger the standard deviation or variance, the more spread out the…

Mean deviation

Mean deviation is a measure of variability that describes the average difference between the values in a dataset and their mean. It is also known as mean absolute deviation (MAD). The formula for calculating the mean deviation is: Mean Deviation = (Σ |xi – x̄|) / n where: Σ represents the sum of the absolute…

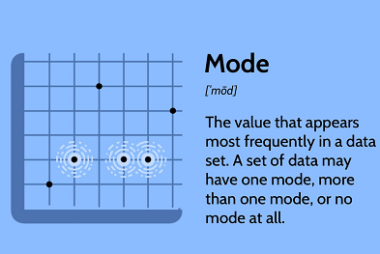
Mode

In probability and statistics, the mode is a measure of central tendency that refers to the most frequently occurring value in a data set. It is the value that appears most often in a set of observations or data. The mode can be applied to both categorical and numerical data. To find the mode of…

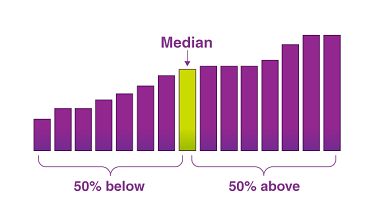
Median

In probability and statistics, the median is a measure of central tendency that represents the middle value of a dataset when it is arranged in ascending or descending order. To find the median of a dataset, you first need to arrange the values in order. If the dataset contains an odd number of values, the…

Mean

In probability and statistics, the mean (also known as the average) is a measure of central tendency. It is calculated by summing up all the values in a data set and dividing by the number of values. The formula for the mean is: mean = (sum of all values) / (number of values) For example,…

Measure of central tendency and dispersion

Sure! Probability and statistics are two interconnected fields of mathematics that deal with the analysis and interpretation of data. A fundamental aspect of both of these fields is the concept of measures of central tendency and measures of dispersion. Measures of central tendency refer to the summary statistics that describe the most typical or representative…

Computation of probability of events using permutations and combinations

Permutations and combinations are two fundamental concepts in probability theory and statistics. They are used to calculate the probability of certain events. A permutation is an arrangement of objects in a particular order, while a combination is a selection of objects without regard to their order. To compute the probability of an event using permutations…