


A random variable is a variable whose value is determined by the outcome of a random event. In probability and statistics, random variables are used to model the uncertainty in the outcomes of experiments or processes.
There are two types of random variables: discrete and continuous.
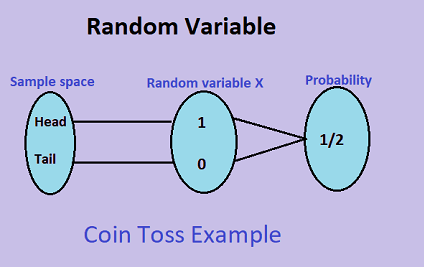
A discrete random variable takes on a countable number of distinct values. For example, the number of heads obtained when flipping a coin is a discrete random variable that can take on only two values: 0 or 1.
A continuous random variable, on the other hand, takes on a continuum of possible values. For example, the height of an adult human is a continuous random variable that can take on any value between a minimum and maximum height.
The probability distribution of a random variable specifies the probability of each possible value of the variable. For a discrete random variable, the probability distribution is often given in the form of a probability mass function (PMF), while for a continuous random variable, it is given in the form of a probability density function (PDF).
The expected value or mean of a random variable is a measure of its central tendency and represents the average value that the variable is expected to take on. The variance of a random variable is a measure of its spread or variability, and represents the average squared deviation from the mean. The standard deviation is the square root of the variance and is another measure of the spread of the random variable.
In statistical analysis, random variables are used to model data and to make inferences about population parameters based on sample data. The theory of probability and statistics provides tools for analyzing and interpreting the behavior of random variables, including hypothesis testing, confidence intervals, and regression analysis.
What is Required Random variable
Probability and statistics are used to model and analyze random variables in various fields, including engineering, economics, social sciences, natural sciences, and more. To work with random variables, it is important to understand the following concepts:
- Probability distributions: A probability distribution specifies the probability of each possible value that a random variable can take on. There are two types of probability distributions: discrete and continuous.
- Expected value and variance: The expected value or mean of a random variable is a measure of its central tendency and represents the average value that the variable is expected to take on. The variance of a random variable is a measure of its spread or variability, and represents the average squared deviation from the mean.
- Probability density functions and cumulative distribution functions: For continuous random variables, probability density functions (PDFs) and cumulative distribution functions (CDFs) are used to describe the distribution of the random variable.
- Central Limit Theorem: The Central Limit Theorem states that the sum or average of a large number of independent random variables with finite variance tends to have a normal distribution.
- Hypothesis testing: Hypothesis testing is a statistical tool used to determine whether a hypothesis about a population parameter is supported by sample data.
- Confidence intervals: A confidence interval is a range of values that is likely to contain the true population parameter with a certain level of confidence.
- Regression analysis: Regression analysis is a statistical tool used to model the relationship between a dependent variable and one or more independent variables.
In summary, probability and statistics are essential for understanding and analyzing random variables and their distributions. These concepts are widely used in various fields to make informed decisions and predictions based on data.
Who is Required Random variable
The understanding of probability and statistics, particularly random variables, is required for various professionals and individuals in many fields, including:
- Statisticians and data analysts: These professionals use probability and statistics to analyze data, make predictions, and draw conclusions about population parameters based on sample data.
- Scientists and researchers: Probability and statistics are essential for designing experiments, analyzing data, and drawing conclusions in various scientific fields, including biology, physics, chemistry, and social sciences.
- Engineers: Probability and statistics are used in the design and analysis of experiments, quality control, reliability analysis, and risk assessment in engineering.
- Economists and financial analysts: These professionals use probability and statistics to model and forecast economic trends, evaluate investment opportunities, and assess risk.
- Business professionals: Probability and statistics are used in marketing research, consumer behavior analysis, risk management, and decision-making in business.
- Medical professionals: Probability and statistics are used in medical research, clinical trials, and epidemiology to analyze data, assess treatment efficacy, and make predictions about disease prevalence and outcomes.
- Educators and students: Probability and statistics are essential for understanding and interpreting data in various academic fields, including mathematics, science, and social sciences.
In summary, probability and statistics are required for many professionals and individuals in various fields to analyze data, make informed decisions, and draw accurate conclusions based on data.
When is Required Random variable
Probability and statistics, particularly random variables, are required in many situations where uncertainty and variability are present. Some common examples include:
- Quality control: Probability and statistics are used in quality control to monitor and improve the quality of products and services by detecting and correcting defects and errors.
- Risk management: Probability and statistics are used in risk management to assess and manage risks in various fields, including finance, insurance, and engineering.
- Decision-making: Probability and statistics are used in decision-making to evaluate alternatives and make informed choices based on data and evidence.
- Experimental design: Probability and statistics are used in experimental design to plan and conduct experiments, analyze data, and draw conclusions about population parameters.
- Forecasting and prediction: Probability and statistics are used in forecasting and prediction to make projections and predictions about future events based on historical data and trends.
- Medical research: Probability and statistics are used in medical research to analyze data, assess treatment efficacy, and make predictions about disease prevalence and outcomes.
- Sports and gaming: Probability and statistics are used in sports and gaming to predict outcomes and make informed decisions based on data and evidence.
In summary, probability and statistics are required in many situations where uncertainty and variability are present, such as quality control, risk management, decision-making, experimental design, forecasting and prediction, medical research, and sports and gaming.
Where is Required Random variable
Probability and statistics, particularly random variables, are required in many fields and industries. Some common examples include:
- Science and research: Probability and statistics are essential for designing experiments, analyzing data, and drawing conclusions in various scientific fields, including biology, physics, chemistry, and social sciences.
- Engineering: Probability and statistics are used in the design and analysis of experiments, quality control, reliability analysis, and risk assessment in engineering.
- Economics and finance: These fields use probability and statistics to model and forecast economic trends, evaluate investment opportunities, and assess risk.
- Business and marketing: Probability and statistics are used in marketing research, consumer behavior analysis, risk management, and decision-making in business.
- Medicine and healthcare: Probability and statistics are used in medical research, clinical trials, and epidemiology to analyze data, assess treatment efficacy, and make predictions about disease prevalence and outcomes.
- Education: Probability and statistics are essential for understanding and interpreting data in various academic fields, including mathematics, science, and social sciences.
- Sports and gaming: Probability and statistics are used in sports and gaming to predict outcomes and make informed decisions based on data and evidence.
In summary, probability and statistics are required in various fields and industries, including science and research, engineering, economics and finance, business and marketing, medicine and healthcare, education, and sports and gaming.
How is Required Random variable
Probability and statistics, particularly random variables, are used in many ways in various fields and industries. Here are some examples of how they are used:
- Predicting outcomes: Probability and statistics are used to predict the likelihood of certain outcomes or events based on historical data and trends. For example, in sports, statistics are used to predict the outcome of games or tournaments.
- Making decisions: Probability and statistics are used to make informed decisions based on data and evidence. For example, in business, statistics are used to make decisions about product development, marketing strategies, and investment opportunities.
- Designing experiments: Probability and statistics are used to design and analyze experiments in various fields, including science and engineering. For example, in biology, statistics are used to design and analyze experiments to study the effects of different treatments on organisms.
- Quality control: Probability and statistics are used to monitor and improve the quality of products and services by detecting and correcting defects and errors. For example, in manufacturing, statistics are used to monitor the production process and identify areas for improvement.
- Risk assessment: Probability and statistics are used to assess and manage risks in various fields, including finance, insurance, and engineering. For example, in finance, statistics are used to evaluate the risk and return of investment portfolios.
- Modeling and forecasting: Probability and statistics are used to model and forecast economic trends, weather patterns, and other phenomena. For example, in economics, statistics are used to forecast the growth of the economy and predict changes in consumer behavior.
In summary, probability and statistics are used in various ways in different fields and industries to predict outcomes, make decisions, design experiments, monitor quality, assess risk, and model and forecast phenomena.
Case Study on Random variable
Case Study: Probability and Statistics in Clinical Trials
Clinical trials are scientific studies that test the safety and efficacy of new medical treatments or interventions in humans. They are essential for bringing new treatments to market and improving patient outcomes. Probability and statistics play a crucial role in clinical trials, from study design and sample size determination to data analysis and interpretation.
Consider the following case study:
A pharmaceutical company has developed a new drug for treating a rare medical condition. The company wants to conduct a clinical trial to test the efficacy and safety of the drug in humans. The trial will involve a randomized, double-blind, placebo-controlled design, which is considered the gold standard in clinical research.
The trial will enroll 100 patients who have been diagnosed with the medical condition. The patients will be randomly assigned to one of two groups: the treatment group or the control group. The treatment group will receive the new drug, while the control group will receive a placebo, which is an inactive substance that looks like the drug.
The primary outcome measure for the trial is the proportion of patients in each group who experience a reduction in symptoms after a specified period of treatment. The secondary outcome measures include adverse events and changes in other clinical parameters.
The trial is designed to have 80% power to detect a difference of 20% in the proportion of patients who experience a reduction in symptoms between the treatment group and the control group, with a significance level of 0.05. This means that if the true difference in proportions is 20%, the probability of correctly rejecting the null hypothesis (i.e., no difference between groups) is 80%, and the probability of incorrectly rejecting the null hypothesis (i.e., Type I error) is 5%.
The sample size for the trial is determined using statistical methods based on the expected effect size, variance, and other factors. In this case, the sample size of 100 is determined to be sufficient to achieve the desired power and significance level.
During the trial, data are collected and analyzed using statistical methods. The data are first checked for completeness and accuracy, and then summarized using descriptive statistics, such as means, standard deviations, and proportions. Inferential statistics, such as t-tests and chi-square tests, are used to compare the treatment group and the control group and to test hypotheses about the effect of the drug.
The results of the trial are interpreted in light of the statistical analysis and other factors, such as clinical significance and safety. If the results are positive, the drug may be submitted for regulatory approval and ultimately brought to market.
In summary, probability and statistics are essential in clinical trials for designing studies, determining sample size, analyzing data, and interpreting results. These methods help to ensure that clinical trials are rigorous, valid, and reliable, and that new treatments are safe and effective for patients.
White paper on Random variable
Introduction:
Probability and statistics are mathematical tools used to analyze and interpret data in many fields such as science, engineering, finance, social sciences, and more. A random variable is an essential concept in probability and statistics, which is used to describe and model the behavior of data that may vary unpredictably over time.
This white paper will provide an overview of probability and statistics, focusing on random variables, their properties, and their applications.
Probability:
Probability is the branch of mathematics that deals with the study of uncertainty. Probability theory is used to describe and model the behavior of events that have some level of uncertainty. It is based on the concept of the sample space, which is the set of all possible outcomes of a random experiment. The probability of an event is defined as the ratio of the number of favorable outcomes to the total number of possible outcomes.
Probability is expressed as a number between 0 and 1, where 0 represents an impossible event and 1 represents a certain event. The probability of an event can be calculated using different methods, such as the classical method, the empirical method, and the subjective method.
Statistics:
Statistics is the branch of mathematics that deals with the collection, analysis, interpretation, and presentation of data. It involves different methods and techniques, such as descriptive statistics, inferential statistics, and data visualization.
Descriptive statistics are used to summarize and describe the characteristics of a set of data. They include measures of central tendency, such as the mean, median, and mode, and measures of variability, such as the standard deviation and variance.
Inferential statistics are used to make inferences or conclusions about a population based on a sample of data. They involve hypothesis testing, confidence intervals, and regression analysis.
Random Variables:
A random variable is a variable whose value is determined by chance or randomness. It is a mathematical function that assigns a numerical value to each possible outcome of a random experiment. Random variables can be either discrete or continuous.
Discrete random variables take on a finite or countable set of values, such as the number of heads in a coin toss or the number of defects in a batch of products. They are often modeled using probability mass functions, which describe the probability of each possible value.
Continuous random variables can take on any value within a range, such as the height or weight of a person. They are often modeled using probability density functions, which describe the probability of a value falling within a certain interval.
Applications:
Random variables are used in many fields and applications, such as:
- Finance: Random variables are used to model and forecast stock prices, interest rates, and other financial variables.
- Engineering: Random variables are used to model and predict the behavior of materials, structures, and systems under different conditions.
- Medical research: Random variables are used to analyze and interpret data from clinical trials and other medical studies.
- Quality control: Random variables are used to monitor and improve the quality of products and services by detecting and correcting defects and errors.
Conclusion:
Probability and statistics, particularly random variables, are essential concepts in many fields and industries. They provide a powerful framework for analyzing and interpreting data, making informed decisions, and predicting outcomes. Understanding probability and statistics and their applications can help individuals and organizations make better-informed decisions and achieve better outcomes.